Wednesday, October 15, 2008

How shall I TADDM the network, if I don't know what it's like?

TADDM, which I've written before, is IBM's detective. It sniffs out and find everything that's connected to the network, interrogates them to find out what's inside and maps out the relationships (who's talking to whom and and who's ignoring whom).

Now, the first time I have to remove the dewy-eyed look from users is when I inform them that, yes, TADDM can discover their unique 3rd-party/in-house applications, BUT... we have to tell TADDM what these products look like so that it can "tag" them correctly. They want TADDM to be able to "guess" or even divine which of the thousands of processes and files scattered around the network are related to which business service they run. TADDM can do that, but it need at least a little help!

The other thing they don't like is when I have to feed TADDM the TCP/IP address scopes and user/passwords of their servers. They say "Why do I need to enter all these things if TADDM is supposed to discover everything by itself?". I must then reassure them that they do not want TADDM to be able to hack into their secure systems without the right credentials!
OK, so TADDM requires the users/passwords for the servers (it can also get the passwords from the organizations LDAP repository) but why does it need me to enter the IP addresses?

For two good reasons: (1) So that  you can give each IP list (scope in TADDM jargon) it's own set of credentials, i.e. IP 200.100.10.1 through 200.100.10.255 uses a certain user/password and a another scope uses a different one. (2) So that you can schedule discoveries by scope, and that way you're not doing the whole net each time.

But... what happens when an organization doesn't know how to split up it's IP range into separate environments? Say there are 200 servers, split into development, test, production and DRP environments all overlapping in the same IP scope. If I tried running discovery, I'd get tons of errors for using wrong user/passwords and I'd get a lot of unneeded devices when all I want is the production environment, unless I matched up IP to environment first.

Of course, the whole point of TADDM is that you don't necessarily know your network ahead of time. So what do you do?

The solution is a bit iterative, but you're not running into errors on the way and you don't need to feed TADDM any knowledge about the way the network is mapped ahead of time. What happens is that TADDM creates something called Logical Connections between devices when it detects that one uses the other. Logical Connections can be between application servers and databases, web servers and storage area network devices, switches and ... you get the idea). Now, once TADDM has completed a discovery, it maps out the Logical Connections between items which lie within it's scope. LC which go beyond the scope are listed, but not displayed on the map.

To leverage this, what we do is get our nose under the tent - we discover a few servers we know are in the right environment, find out which servers they are connected to, add them to the scope and continue till we have discovered everything in the environment we are interested in.

There are two ways of listing Logical Connections outside of the TADDM GUI:

  1. ./api.sh -u username-p password find LogicalConnection
    api.bat for Windows users.
  2. Connect to the database and run select distinct fromip_x, toip_x from logcconn

The first command will create an XML file with all the data, the second regular SQL. I used the second command (slightly modified to ignore 127.0.0.1 and output the data nicely) to create a script file which runs loadscope after the select and then I get an ever expanding scope which contains items which are talking to each other.

Don't forget that loadscope looks for a file formatted like this:

IP_Address/range/subnet, Exceptions, Description 
IP_Address/range/subnet, Exceptions, Description

Thanks to Byron for the help :)

Hmph.... This post seems a little too long for what I wanted to say... I hope I was clear in the end.

-- Robert
Tuesday, October 14, 2008

Hannibal - The Webcomic

Many people's first exposure to the ancient world of Rome is through the books they read as children. I first encountered Julius Caesar in reading the legendary comic book series Asterix. Mixing the old world with new technologies means that web-comic interpretations of the classical world  were just a matter of time:

From <http://newsok.com/hannibals-epic-campaign-comes-to-web-based-comic/article/3309191>:
=============================================================================
Hannibal's epic campaign comes to Web-based comic
WORD BALLOONS
BY MATTHEW PRICE
Published: October 10, 2008
Most have heard the story of the Carthaginian general Hannibal leading elephants across the Alps to face the Romans. Writer Brendan McGinley wants you to see it.
"There's already plenty of good prose about Hannibal, (but) no good visual medium for a story that crackles with so many unforgettable images, like elephants on the Alps or Mago Barca spilling dead Romans' rings on the Senate floor," he said. "Maybe Vin Diesel's long-stalled film will change that; Victor Mature's sure didn't."
McGinley and artist Mauro Vargas, along with colorist Andres Carranza, bring the Hannibal story to life — with some humorous asides — re-enacting the second Punic War on the Shadowline Web comics page, <http://www.shadowlinecomics.com/webcomics/#/hannibalgoestorome/>.

Vargas "really defines and expresses his characters; you need that where history meets comedy," McGinley said. McGinley said the trickiest part of creating "Hannibal Goes to Rome" is sorting which Carthaginian did what.
"There are so many Hannos, Hannibals, Hasdrubals and Giscos!" McGinley meshes historical accounts to create the tale, which he then passes on to Vargas to draw. "The historians and artist make it easy for me; all I have to do is throw a little observational humor into the mouths of the poor schlubs caught up in events," he said.
"Hannibal Goes to Rome" was first a candidate on DC Comics' Zuda site (www.zudacomics.com). Zuda is a site created to seek fresh talent.
After competing on Zuda, McGinley hooked up with Shadowline's Jim Valentino, who was looking to launch some Web comics.

Saturday, September 20, 2008

Reports

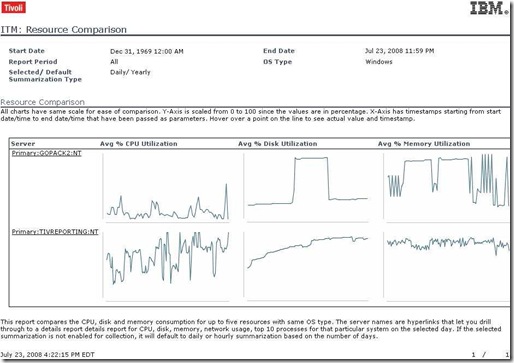
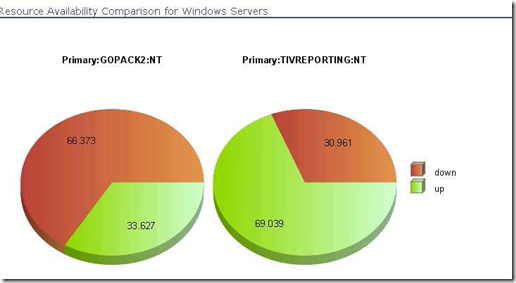
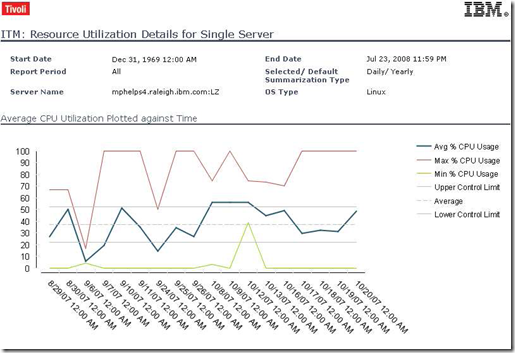
It's all very well to have a display of what is going on in your system at the moment - but what's been happening during the course of last month? Can you compare last year to today? How can I prove that whatever-change-was-just-made has (or has not) made a difference?


Sure, you can hack together an SQL routine or Perl script to get the raw data out of the monitoring system, but then what about showing your conclusions to someone who doesn't speak your type of jargon? You need something which creates reports which have been made for human eyes - not man/machine hybrids.

In other words, you need reports so you can translate your technical knowledge into business knowledge and in that way share your IT information with the decision making sections of your company/organization.


image 

TCR1

image

One of the nicer ideas in Tivoli at the moment is the gradual merging of all the various reporting routines in the myriad Tivoli products.

IBM has taken the standard BIRT reporting system and wrapped it up as Tivoli Common Reporting (TCR) - all the cooler newer versions of the Tivoli family have their reports in this new standard. The site I linked to has a list of all the TCR offerings. More and more of them are published on OPAL all the time. ITM6.2 reports have just had an update, for example.

Using BIRT means that the reporting engine is (a) free and (b) easily customizable - for those who know what they're doing with it. Alas, I'm not yet quite good enough with BIRT to create my own extra-special reports.

The next version of TADDM will use these reports and I'm curious as how to go about creating a "mashup" of a report which merges CMDB data with monitoring events - for example, how about a report which shows Number of Failures as a function of Number of Configuration Changes across the organization?

-- Robert

Friday, September 12, 2008

Flush the buffer

A recent conversation in the Developerworks ITM 6.x forum dealt with an unusual problem with Universal Agents.
A few rows were showing up cropped - only the first part of the line was making it's way from the UA to the TEMS/TEPS database.

The root of the problem turned out to be the UA's "unflushed buffer". What is a buffer and why should it be flushed?
A computer program, be it a simple "hello world" application or a complex missile control system, can often be summarized like this:

Get Input -> Do Something -> Write Output and repeat.

Now, things get complicated when we try to be more efficient. Say we've got a script which is checking a series of files/disks/servers/anything. If it wrote the result of each check immediately then the hard disk writing heads would constantly be starting and stopping - which is not efficient. What happens (behind the scenes) is that the operating system creates a Buffer of information which holds the lines temporarily. Once enough lines have been written into the buffer, the buffer is written (flushed) to the disk. This translates as much less starting and stopping of the disk heads. If you run the script yourself then you'll see everything displayed on the screen because the operating system will flush the buffer at the end of the script - at the latest.

Now, I don't know what the exact reason for the UA losing parts of lines, but I assume that the way the script UA works is reading the buffer that the script writes. If the UA reads the buffer BEFORE the operating system flushes the buffer then the UA will only get part of the information. This will not affect all UAs, but it might come and bite a few.

There is a full solution in the works, but a good workaround (for Perl) in the meantime is to add the following line to the beginning of the script:

BEGIN { $| = 1; }

This will make sure that the operating system flushes the buffer at the end of every output operation and that guarantees that the script and the UA are synchronized. If you're using other script languages, you'll have to find the equivalent function.

This also happened to me way-back-when when I was writing DCL scripts for the OpenVMS operating system. Just goes to show that what comes around, goes around! It also demonstrates that we Tivoli types need a good background in general computer science knowledge to help us solve fiddly little problems.

-- Robert

Thursday, July 31, 2008

TADDM logs and logging tips

A good TADDM technote has been published. It lists the various logs and their meanings.
The logs are located in $COLLATION_HOME\log. I've bolded the more useful ones.

control.log - contains messages from the start script

cdm.log - web portal logs are located here

discover.log - contains messages from the Discover jini service

discover-admin.log - contains messages from the DiscoverAdmin jini service

error.log - contains serious errors for any of the TADDM/CDT services

events-core.log - contains messages from the events core jini service

l2.log - contains messages for the layer2

local-anchor.<hostname>.log - logs messages from J2EE sensors

login.log - user login audit trail

proxy.log - contains messages from the Proxy jini service

tomcat.log - contains messages from the startup sequence

topology.log - contains messages from the topology jini service

services/ApiServer.log - XML, Java and EJB interfaces to CMDB are processed here

services/ChangeManager.log - ChangeManager works with StateManager to process change events after discovery completes

services/ClientProxy.log - start here for GUI issues. The GUI talks to client proxy exclusively

services/DiscoverManager.log - contains message for Sensor and Template Matcher messages (see comment further on)

services/DiscoverObserver.log - moves completed work items from DiscoverManager to TopologyManager

services/MonitorStateManager.log - processes discovery and change events

services/ProcessFlowManager.log - event processing engine for Discovery

services/ReportsServer.log - Handles some reports tasks

services/TopologyManager.log - interface between all other components and the datastore.

services/ViewManager.log - ViewManager builds the CI navigation trees

If the setting com.collation.discover.engine.SplitSensorLog is set to TRUE in the /etc/collation.properties then each sensor will have it's own log in the directory log/sensors/<runid>/sensorName-IP.log. this is VERY useful in debugging discovery errors. If the value is set to FALSE then the DiscoveryManager will contain all the messages running together. I always make sure the SplitSensor is set to TRUE.

Here are some more log file settings which are defined in the /etc/collation.properties file

  • com.collation.log.level - Logging level. Default is INFO, I set it to DEBUG whenever I need to see why a discovery failed. At DEBUG level you'll see the precise taddmtool command which was run and the server's response.
  • com.collation.deploy.dynamic.logging.enabled - If true, you don't have to restart TADDM when you change logging settings. I always make sure this is true, the (slight) performance drop you (might) get due to the constant rechecking is worth it when you want to debug a discovery.
  • com.collation.log.filesize - Controls the maximum size of each log file. Default is 20 Megabytes. When is limit is reached, the file is renamed and a new file is started.
  • com.collation.log.filecount - Maximum number of log files created (older ones are deleted). Default is 3.

-- Robert

Tuesday, July 29, 2008

Simpler than I thought

OK, Here's the situation:
I've got an ITM/TBSM environment where the tech guys look at ITM screens and the helpdesk and managers look at TBSM screens.

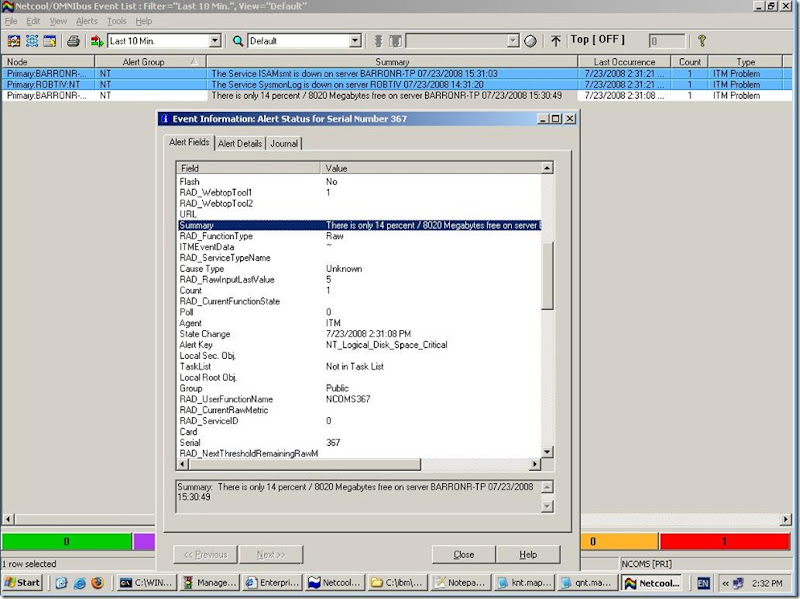
I've got a custom canvas or two for eye-candy on the TBSM. The problem is that when the helpdesk or managers looks at the messages coming over from ITM - they get a heart attack! A simple "no room on disk" turns into : NT_Disk_Full [(Free_Megabytes < 1000000) ON "Primary:AlphaServer:NT" ON D: (Free_Megabytes = 114)]

What I want to do is just change the main text which is sent from ITM to TBSM. Sounds simple?

Now, there are three basic ways in which you can find how to do something in Tivoli:

  1. You can read the basic documentation. However, some things are written in a comprehensive, rather than simple fashion:
    I defy anyone who is not an expert to make use of Chapter 6 of the Admin's guide : Customizing event integration with Tivoli Netcool/Omnibus!
  2. You can go online to a number of forii (plural of forum) and places and ask. However, you probably won't get a cook-book answer - unless you're pointed to somewhere else.
  3. The third option are the how-to guides which are periodically published. The most well known are the Redbooks - but I didn't find what I'm looking for there.
    I did find Coding an event mapping file for ITM TEC Event Forwarder - but it's got too much TEC specific hay which hides the needle I'm looking for.
    I also found Enriching IBM Tivoli Monitoring (ITM) Events For IBM Tivoli Business Service Manager (TBSM) in the TBSM Wiki. This is NEARLY what I'm looking for, except that it's got some BSM "hay" and modifies much too many files or databases to be "simple" enough for my needs.

I did all of this, came to the conclusion that it's complicated, and left it alone for a few months. Till last week when I HAD to do it :)

I did, however, get enough out of all sources (which are excellent sources - especially the last one, which talks about adding important information to the situation data en-route to TBSM) to do it myself and discover that the beast wasn't as bad as I had feared. I could even create this simple how-to which I will share with you.

The secret lies in what are called "mapping files". These mysterious configuration files lie in the directory C:\IBM\ITM\CMS\TECLIB (replace C:\IBM\ITM with whatever's relevant to you) and defines what changes, if any, ITM makes to the various parameters it passes to TEC or Omnibus through the EIF adapter.

Open one up and you'll see a thick wall of XML code.

The good thing is that you can ignore ALL the *.map files which already exist - they're used for integration with ITM5 and DM3.7 (as far as I can tell)

I created a new file called qnt.map 

The first lines I just copied/pasted from an existing map file and then then I changed the <id> from the original file
Then I added my first original material - the situation I'm interested in. The mapAllAttributes tell ITM to send all the attributes, including those I haven't changed.
The information between dollars comes from the attributes which are relevant to the situation. Edit your situation and click the "add conditions" buttons to see the what items you can use.

Note the use of $hostname$ for the server which triggered the situation.

<itmEventMapping:agent                                                         
    xmlns:itmEventMapping="
http://www.ibm.com/tivoli/itm/agentEventMapping"
    xmlns:xsi="http://www.w3.org/2001/XMLSchema-instance"
    xsi:schemaLocation="http://www.ibm.com/tivoli/itm/agentEventMapping agentEventMap.xsd">

    <id>99</id>                                                                
    <version>6.2.0</version>                                                   
    <event_mapping>              

         <situation name="NT_Logical_Disk_Space_Critical" mapAllAttributes="Y">
         <class name="NT"/>
             <slot slotName="msg">

                 <literalString value="There is only $NT_Logical_Disk.%_Free$ percent / $NT_Logical_Disk.Free_Megabytes$ Megabytes free on server $hostname$ $NT_Logical_Disk.Timestamp.TIMESTAMP$"/>
             </slot>
         </situation>

         <situation name="NT_Services_Automatic_Start" mapAllAttributes="Y">
         <class name="NT"/>
             <slot slotName="msg">
                 <literalString value="The Service $NT_Services.Service_Name$ is down on server $hostname$ $NT_Logical_Disk.Timestamp.TIMESTAMP$"/>
             </slot>
         </situation>

    </event_mapping>
</itmEventMapping:agent>

After you have your file, run the command tacmd -t all so that ITM will load the new mapping file.

THAT'S IT!

Triggering those situations will lead to Omnibus messages which look like this:

Normal Event Text


instead of the cryptic formula which we had before.

Just goes to show - sometimes things are simpler than I think!

-- Robert

Sunday, July 20, 2008

A Man on the Moon

I'll write a longer post tomorrow of the next day, but I've got to put something up now. 39 years ago, at 02:56 GMT 21st of July, 1969 a man, Neil Armstrong, stepped on the Moon.

"That's one small step for [a] man, one giant leap for mankind"

If thinking about that doesn't make you pause, then think about it again.

Read more about the mission here on Kennedy Space Center's site and Wikipedia.

During the last few days there have been some amazing results from some newer missions:
The EPOXI mission has video showing the Moon orbiting the Earth. I know that we all know this logically, but here you can actually SEE the moon moving!


For more details, see the Bad Astronomy Blog - which is actually very good.


Another space probe, called SELENE, has taken pictures of the moon which show debris from a later moon landing, Apollo 15.

Last link for now - VERY high resolution images of Tycho, one the largest craters on the Moon taken by SELENE,


Think about it again when you look up at the moon. 39 years ago there was someone there!

-- Robert