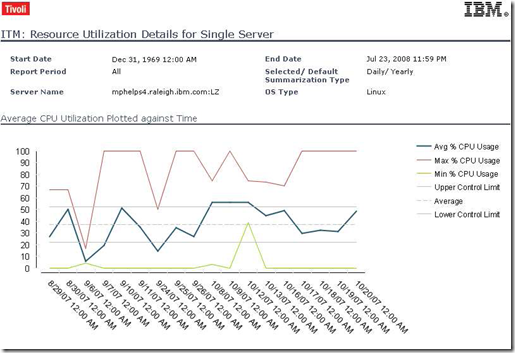
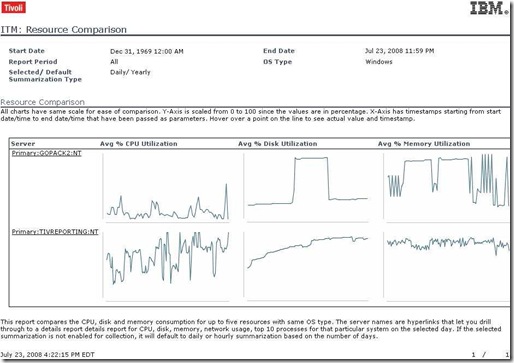
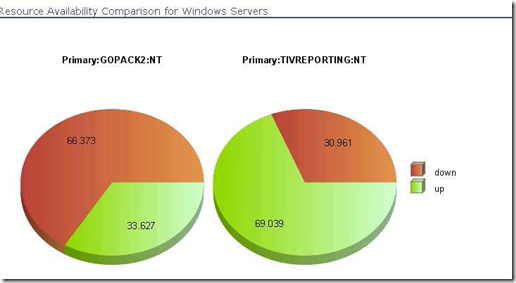
It's all very well to have a display of what is going on in your system at the moment - but what's been happening during the course of last month? Can you compare last year to today? How can I prove that whatever-change-was-just-made has (or has not) made a difference?
Sure, you can hack together an SQL routine or Perl script to get the raw data out of the monitoring system, but then what about showing your conclusions to someone who doesn't speak your type of jargon? You need something which creates reports which have been made for human eyes - not man/machine hybrids.
In other words, you need reports so you can translate your technical knowledge into business knowledge and in that way share your IT information with the decision making sections of your company/organization.
One of the nicer ideas in Tivoli at the moment is the gradual merging of all the various reporting routines in the myriad Tivoli products.
IBM has taken the standard BIRT reporting system and wrapped it up as Tivoli Common Reporting (TCR) - all the cooler newer versions of the Tivoli family have their reports in this new standard. The site I linked to has a list of all the TCR offerings. More and more of them are published on OPAL all the time. ITM6.2 reports have just had an update, for example.
Using BIRT means that the reporting engine is (a) free and (b) easily customizable - for those who know what they're doing with it. Alas, I'm not yet quite good enough with BIRT to create my own extra-special reports.
The next version of TADDM will use these reports and I'm curious as how to go about creating a "mashup" of a report which merges CMDB data with monitoring events - for example, how about a report which shows Number of Failures as a function of Number of Configuration Changes across the organization?
-- Robert


